
Key Metrics to Check in Stock Apps for Accurate Market Insights
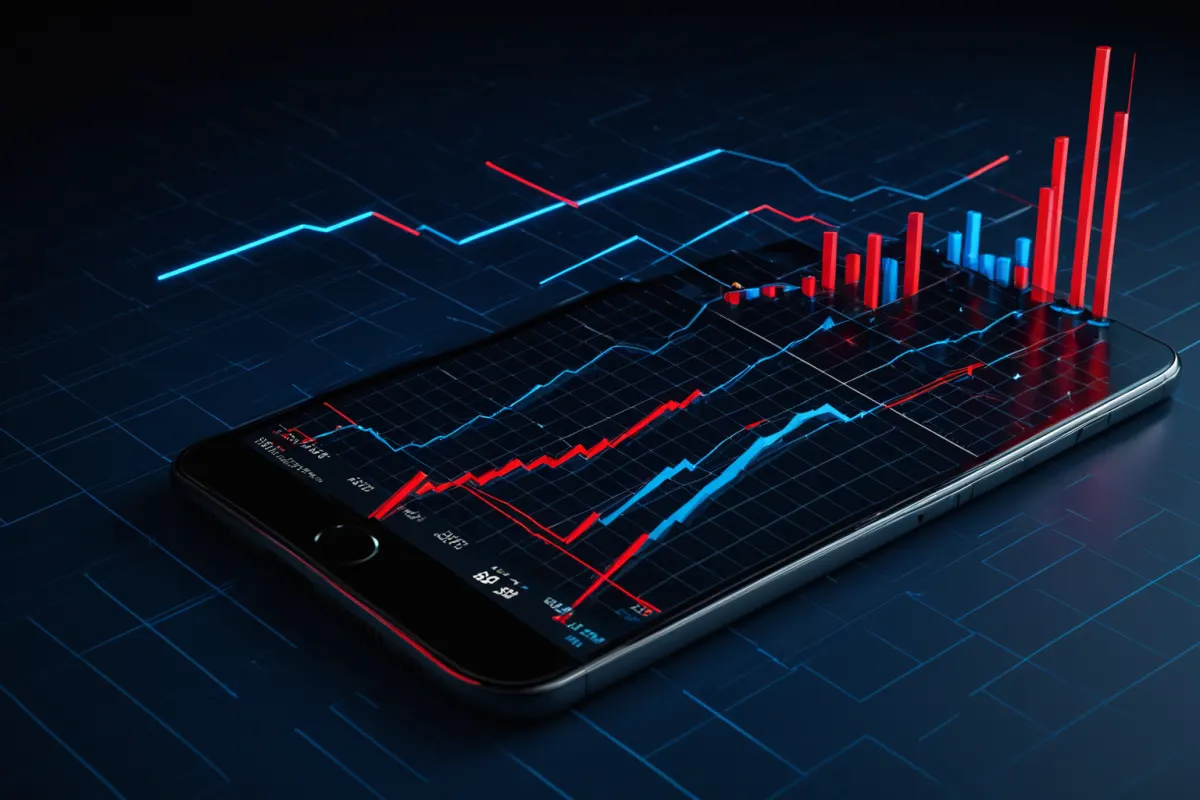
Stock prices aren't just about the current number—it's important to look at multiple factors together. Stock apps display not only the current price but also changes, trading volume, bids, and execution strength, which reveal real market trends. Checking the KOSPI index or sector performance alongside individual stocks helps determine if movements are due to a single stock or broader market conditions.
Current Price: The Starting Point
The current price is usually the first thing you see when opening a stock app, but focusing solely on this number isn't helpful. It's just a reference point for the day—what matters more is how much it has changed compared to yesterday and where it moved during the session.
For example, well-known stocks like Samsung Electronics might seem less meaningful at first glance, but whether they rise sharply in the morning then fall back or recover in the afternoon is what really matters. Different price movements can lead to different future trends even if the numbers look similar.
At first, checking the change percentage next to the current price is enough. A red number doesn't always mean good news, and blue doesn't always mean bad—especially on weak market days when stocks that don't drop as much might actually be stronger than others.
You can find more articles on similar topics here.
View Related ArticlesWhy Trading Volume Matters for Price Direction
Trading volume is more important than many realize. If prices rise but volume stays low, it might indicate weak momentum. On the other hand, rising prices with increasing volume suggest strong interest and active buying.
Conversely, if prices fall sharply with high volume, it could signal strong selling pressure. In such cases, don't jump in just because the price is low—first understand why trading activity has increased.
It's a good habit to keep the volume bar visible below your chart on stock apps. At first glance, it might seem complicated, but after seeing it a few times, you'll quickly get a sense of whether trading activity follows price movement.
Reading Buy/Sell Strength from the Order Book
The order book is useful for understanding real-time stock prices. By seeing how buy and sell orders are stacked, you can guess short-term momentum direction—but don't make hasty decisions based on it alone.
For instance, if there's a thick wall of sell orders at the top but trades keep moving upward, it suggests strong buying pressure. Conversely, even if many buy orders appear, if trades continue to move downward, real strength may be weak.
New users often mistakenly think more numbers in the order book mean better performance, but execution matters more than just order volume. Orders stacked up don't always reflect actual trading intent.
Understanding Execution Strength and Speed
Execution strength shows whether buying or selling is dominant at a given moment and is commonly used by traders. While stock apps may display it differently, this metric is frequently checked for short-term trades.
If execution strength remains high, it usually means strong short-term buying interest. However, relying solely on this number to decide when to buy can be risky—many stocks appear strong during good market days.
It's also helpful to check execution speed. Rapid changes often reflect news or supply-demand shifts, especially in volatile sectors like biotech stocks where these movements are more noticeable.
Support and Resistance Levels on Charts
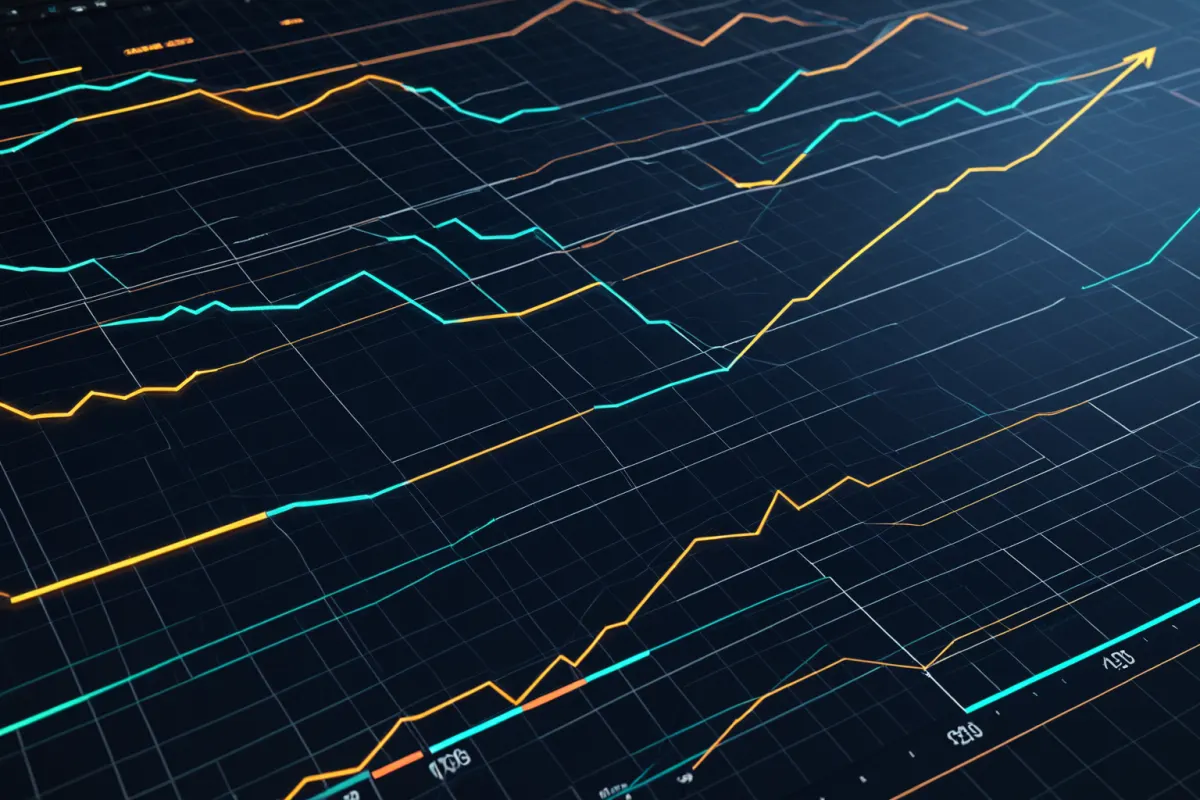
Charts help you see longer-term trends beyond daily price movements. It’s important to view at least 1-day and 1-week charts together because focusing only on a single day can miss key patterns.
For example, if prices have bounced back multiple times from the same level, that area likely acts as support. Similarly, levels where prices repeatedly struggle to rise may indicate resistance. These areas help guide buy/sell decisions.
In reality, it's better to view these as price ranges rather than exact lines—prices often fluctuate by 1-2%, so judging based on a single point can be too rigid. In the stock market, interpreting ranges is more practical and realistic.
Checking the KOSPI Index and Sector Trends
Focusing only on individual stocks leads to confusion. Even on the same day, if the KOSPI index is strong, a stock that looks weak might hold up better. Conversely, when the overall market is weak, even good stocks can get dragged down.
Therefore, it's advisable to check both the index and sector trends alongside individual stock charts in your app. Even within sectors like semiconductors or biotech, capital flows vary by timing—understanding this flow makes selecting stocks easier.
For example, stocks with clear industry-specific traits (like those tracked by NICE Information) may be influenced more by company-specific news than overall market trends. For these, it's important to monitor both the index and sector movements together.
Simple Checklist for Beginners
With so many metrics, starting with a simple order makes it much easier. When you open a stock in your app, follow this sequence:
- Check current price and change percentage
- Compare trading volume to usual levels
- Review the order book for buy/sell balance
- Look at recent support/resistance levels on the chart
- Check KOSPI index and sector trends
Just these five points can help you make most basic decisions. Instead of jumping into news first, reviewing numbers and charts before seeking reasons is more practical for real trading.
For example, if a stock rises 3% with double the usual volume and holds above support levels, it likely has short-term interest. Conversely, a 3% rise with no volume and weak index suggests it might just be a temporary bounce.
Common Mistakes in Reading Stock Prices
A common mistake is following only red numbers (price increases) without understanding context. Stocks that surge quickly are often already overbought—especially on theme-driven days when early gains can fade sharply in the afternoon.
Another frequent error is assuming a stock is cheap because it's below yesterday's closing price. Stock prices alone don't indicate value; you need to consider volume, earnings expectations, and sector conditions for meaningful insight.
For stocks sensitive to news (like biotech), small updates can cause big swings. In such cases, checking the order book alongside announcements, supply-demand trends, and sector movements is safer than relying on price alone.
Commonly Overlooked Details
One often missed detail in stock apps is trading value (not just volume). Trading value shows how much actual money has flowed into a stock, which can be especially useful for large-cap stocks with high market capitalization.
Another overlooked factor is timing. Price movements right after market open differ from those during lunch or later in the day. For example, stocks that surge early may lose momentum by afternoon—so it's helpful to analyze price trends in segments throughout the day.
The reason you shouldn't compare stock prices directly with index movements is because indices represent average market performance while individual stocks can move much more dramatically based on news and supply-demand factors.
How Proper Stock Price Reading Changes Investment Decisions
Developing a habit of reading stock prices correctly helps reduce emotional reactions to others' opinions. As you learn to read numbers, you'll be less influenced by urgent news. Ultimately, your stock app becomes more than just a tool for checking prices—it's a decision-making aid.
You don't need perfection from the start. Simply consistently reviewing current price, volume, order book, charts, and index can make a noticeable difference. Often, taking an extra moment to check these details helps avoid losses.
Since real-time data changes constantly with news and updates, it's always best to double-check today’s figures before making any trades.
FAQ
Q1. What should I check first when looking at stock prices?
Start with current price and change percentage, then immediately compare volume and chart patterns. Relying on just one number can lead to shaky decisions.
Q2. Can I determine buy timing from the order book alone?
No—while useful as a reference, an order book filled with pending orders doesn't always mean active trading. Execution matters more than order volume.
Q3. Should I focus more on individual stocks or the KOSPI index?
You should check both. Even if a stock looks good, it may be limited in movement during weak market conditions.
Continue exploring similar topics.
View Category ArticlesFAQ
What should I check first when looking at stock prices?
Start with current price and change percentage, then immediately compare volume and chart patterns. Relying on just one number can lead to shaky decisions.
Can I determine buy timing from the order book alone?
No—while useful as a reference, an order book filled with pending orders doesn't always mean active trading. Execution matters more than order volume.
Should I focus more on individual stocks or the KOSPI index?
You should check both. Even if a stock looks good, it may be limited in movement during weak market conditions.
Korean Source
This article is an English localization of a Korean-language report from BlogScore. Original: 주식시세 보는 기준, 증권 앱에서 확인해야 할 핵심 항목