
Building an Admin Analytics Dashboard with Next.js and Chart.js
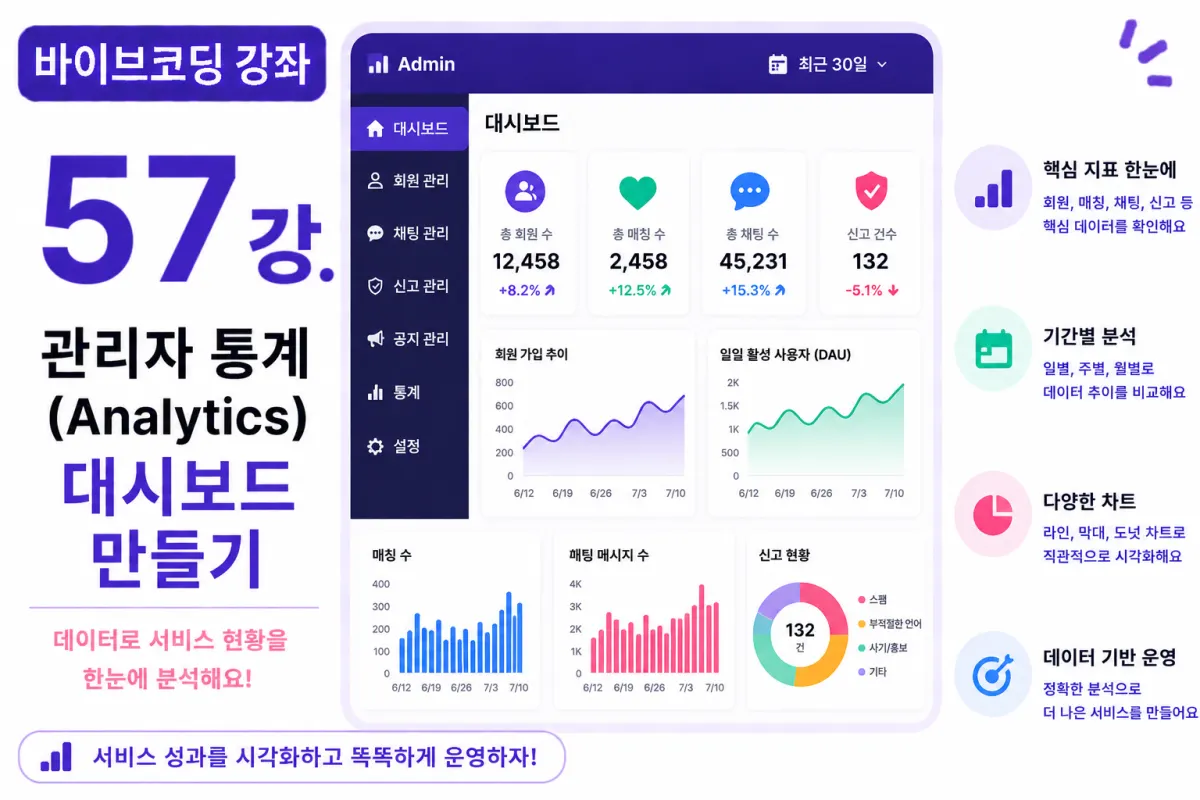
What You'll Learn in This Lesson
In the previous lesson, we implemented an Activity Log system.
Now, administrators can view all major events occurring within the service.
In this lesson, we'll implement an Analytics Dashboard that utilizes this data.
We'll cover these topics together:
User Statistics
Matching Statistics
Chat Statistics
Report Statistics
Chart Visualization
Period-Based Analysis
By the end of this lesson, you'll be able to operate your service based on data-driven insights.
What is Analytics?
Analytics is a system that analyzes service data and displays operational status at a glance.
Rather than just listing numbers, it uses graphs and charts to make changes easy to see.
Why Do You Need Statistics?
When operating a service, you might wonder:
How many new users signed up today?
Are matches increasing?
Is chat activity active?
Are reports rising?
Analytics provides answers to these questions.
Requesting Help from Cursor AI
First, we'll ask Cursor AI to create the admin Analytics Dashboard using Next.js and Chart.js:
Build an Admin Analytics Dashboard using Next.js and Chart.js.

Visualize user sign-ups, matches, chats, and reports with charts.
The AI generates chart components and data retrieval code together.
User Sign-Up Trends
The first chart shows user sign-up trends.
It displays daily, weekly, and monthly sign-ups using a Line Chart.
This makes it easy to see the rate of member growth.
Daily Active Users (DAU)
DAU (Daily Active Users) refers to the number of users who accessed the service in one day.
It can be calculated based on login records or activity logs.
This is a key metric for assessing service engagement.
Matching Statistics
We'll check matching numbers by period:
Today's matches
Matches this week
Matches this month
This is one of the most important metrics for dating apps.
Chat Statistics
We'll also analyze chat volume:
Total messages sent
Average daily messages
Active chat rooms
This helps easily gauge user activity levels.
Report Statistics
We'll display the number of reports received in a chart.
If reports suddenly increase, administrators can respond immediately.
This helps maintain service quality.
Using Chart.js
In this lesson, we'll use Chart.js.
The most commonly used charts are:
Line Charts
Bar Charts
Doughnut Charts
We'll choose the appropriate chart based on data characteristics.
Selecting Time Periods
Administrators can change the period for analysis:
TODAY

LAST 7 DAYS

LAST 30 DAYS

LAST YEAR
We'll implement this functionality to allow selection like the example above.
Creating KPI Cards
Below the charts, we'll display key performance indicators (KPIs) in card format:
Total members
Active users
Total matches
Total chats
This allows administrators to quickly see key information on the first screen.
Improving with Cursor AI
After completing the feature, ask Cursor AI:
Improve the Analytics Dashboard for better visual appeal.
The AI will suggest improvements to:
Chart design
Responsive layout
KPI card composition
Performance Optimization
Statistics aren't calculated in real-time every time.
We can improve query speed by using aggregation queries or operating separate statistics tables when needed.
Permission Management
Analytics is accessible only to administrators.
Regular users cannot access it, thanks to Row-Level Security (RLS) and server permission checks.
Testing the Dashboard
Test in this order:
Log in as an administrator
Navigate to the Analytics screen
Check user statistics
Check matching statistics
Check chat statistics
Check report statistics
If all charts display correctly, the Analytics system is complete.
GitHub Commit
Once completed, ask Cursor AI to write a commit message:
Create a Git commit message for implementing the Analytics Dashboard.
Committing features individually makes maintenance easier.
Additional Features in Production
In actual services, these additional features are often provided:
Regional statistics
Gender statistics
Age group analysis
Sign-up source analysis
CSV download
PDF report generation
This project focuses on implementing core Analytics features only.
You Can Now Operate Your Service Data-Driven
By the end of this lesson, administrators will be able to analyze:
User growth
Matches
Chats
Report status
All at a glance. A data-driven operational environment is now complete.
Next Lesson Preview
In the next lesson, we'll enhance the search system.
We'll implement advanced search and filtering features using nicknames, interests, location, and age to help users find matches more easily.
Conclusion
This lesson implemented an admin Analytics system for a dating app.
We visualized user statistics, matching statistics, chat statistics, and report statistics, creating an environment where services can be operated based on data insights.
In the next lesson, we'll enhance search and filtering features to further improve user experience.
FAQ
What is the purpose of an Analytics Dashboard for a dating app?
It provides administrators with visual insights into key metrics like user growth, matches, chat activity, and reports to make data-driven decisions.
How does DAU (Daily Active Users) help in service management?
DAU measures daily engagement by counting users who accessed the service that day, helping assess overall service health and activity levels.
Korean Source
This article is an English localization of a Korean-language report from BlogScore. Original: [바이브코딩 강좌] 57강. 관리자 통계(Analytics) 대시보드 만들기